Performance3 min readBy Fuorix
Slow Website Costing You Leads? How We Fix Load Time for SMB Sites
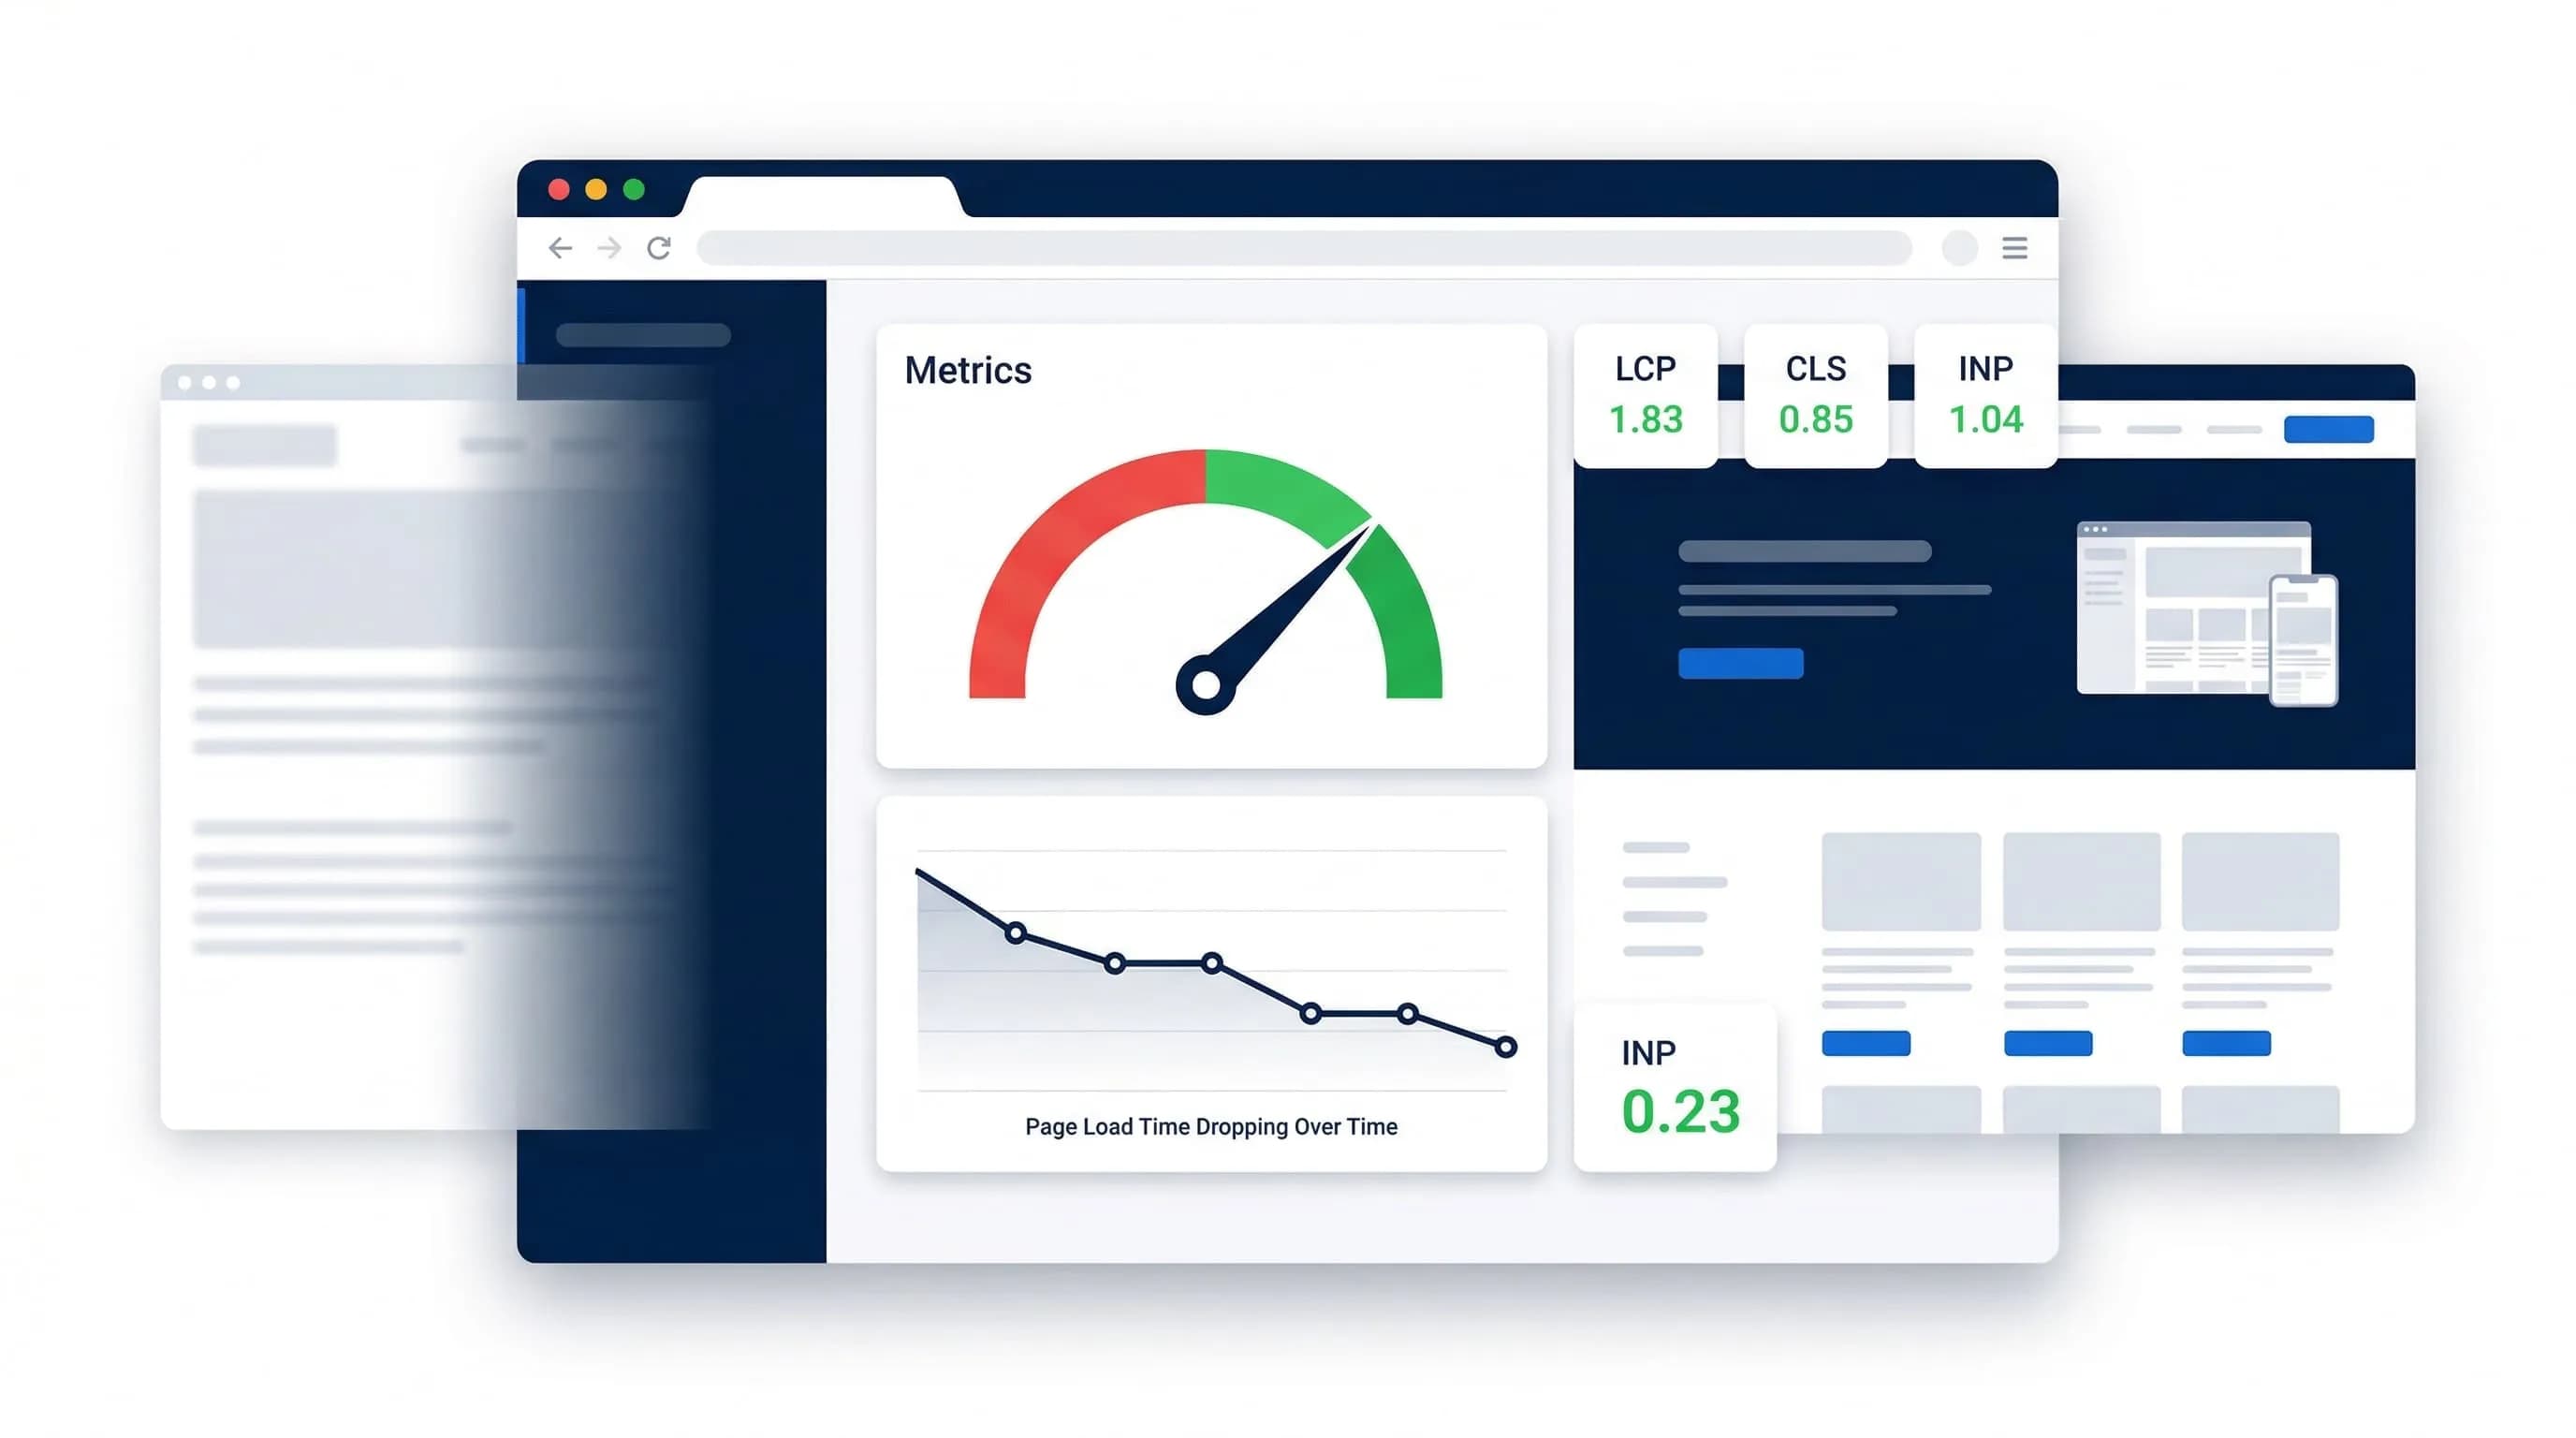
Every extra second of load time costs you enquiries, especially on mobile in the UAE where most visitors arrive from Instagram and WhatsApp. Here is how we diagnose a slow site, what we fix first, and what it costs.
A business owner in Sharjah sent us a site last month that took nine seconds to load on a phone. Their Instagram ads were working. The website was throwing the leads away.
If your site takes more than three seconds to become usable on mobile, you are losing enquiries you already paid for. The good news is that most of it is fixable without a redesign.
What a speed fix costs with us: an audit and the first round of fixes (images, caching, scripts, hosting) is a fixed $300 to $800 depending on the platform, and takes about a week. If the site is on an old template that cannot be saved, a rebuild in Next.js starts from $500. Run your site through PageSpeed Insights first, then send us the score and we will tell you which of the two you need.
The rest of this post is the practical checklist we work through.
Why page speed directly impacts revenue
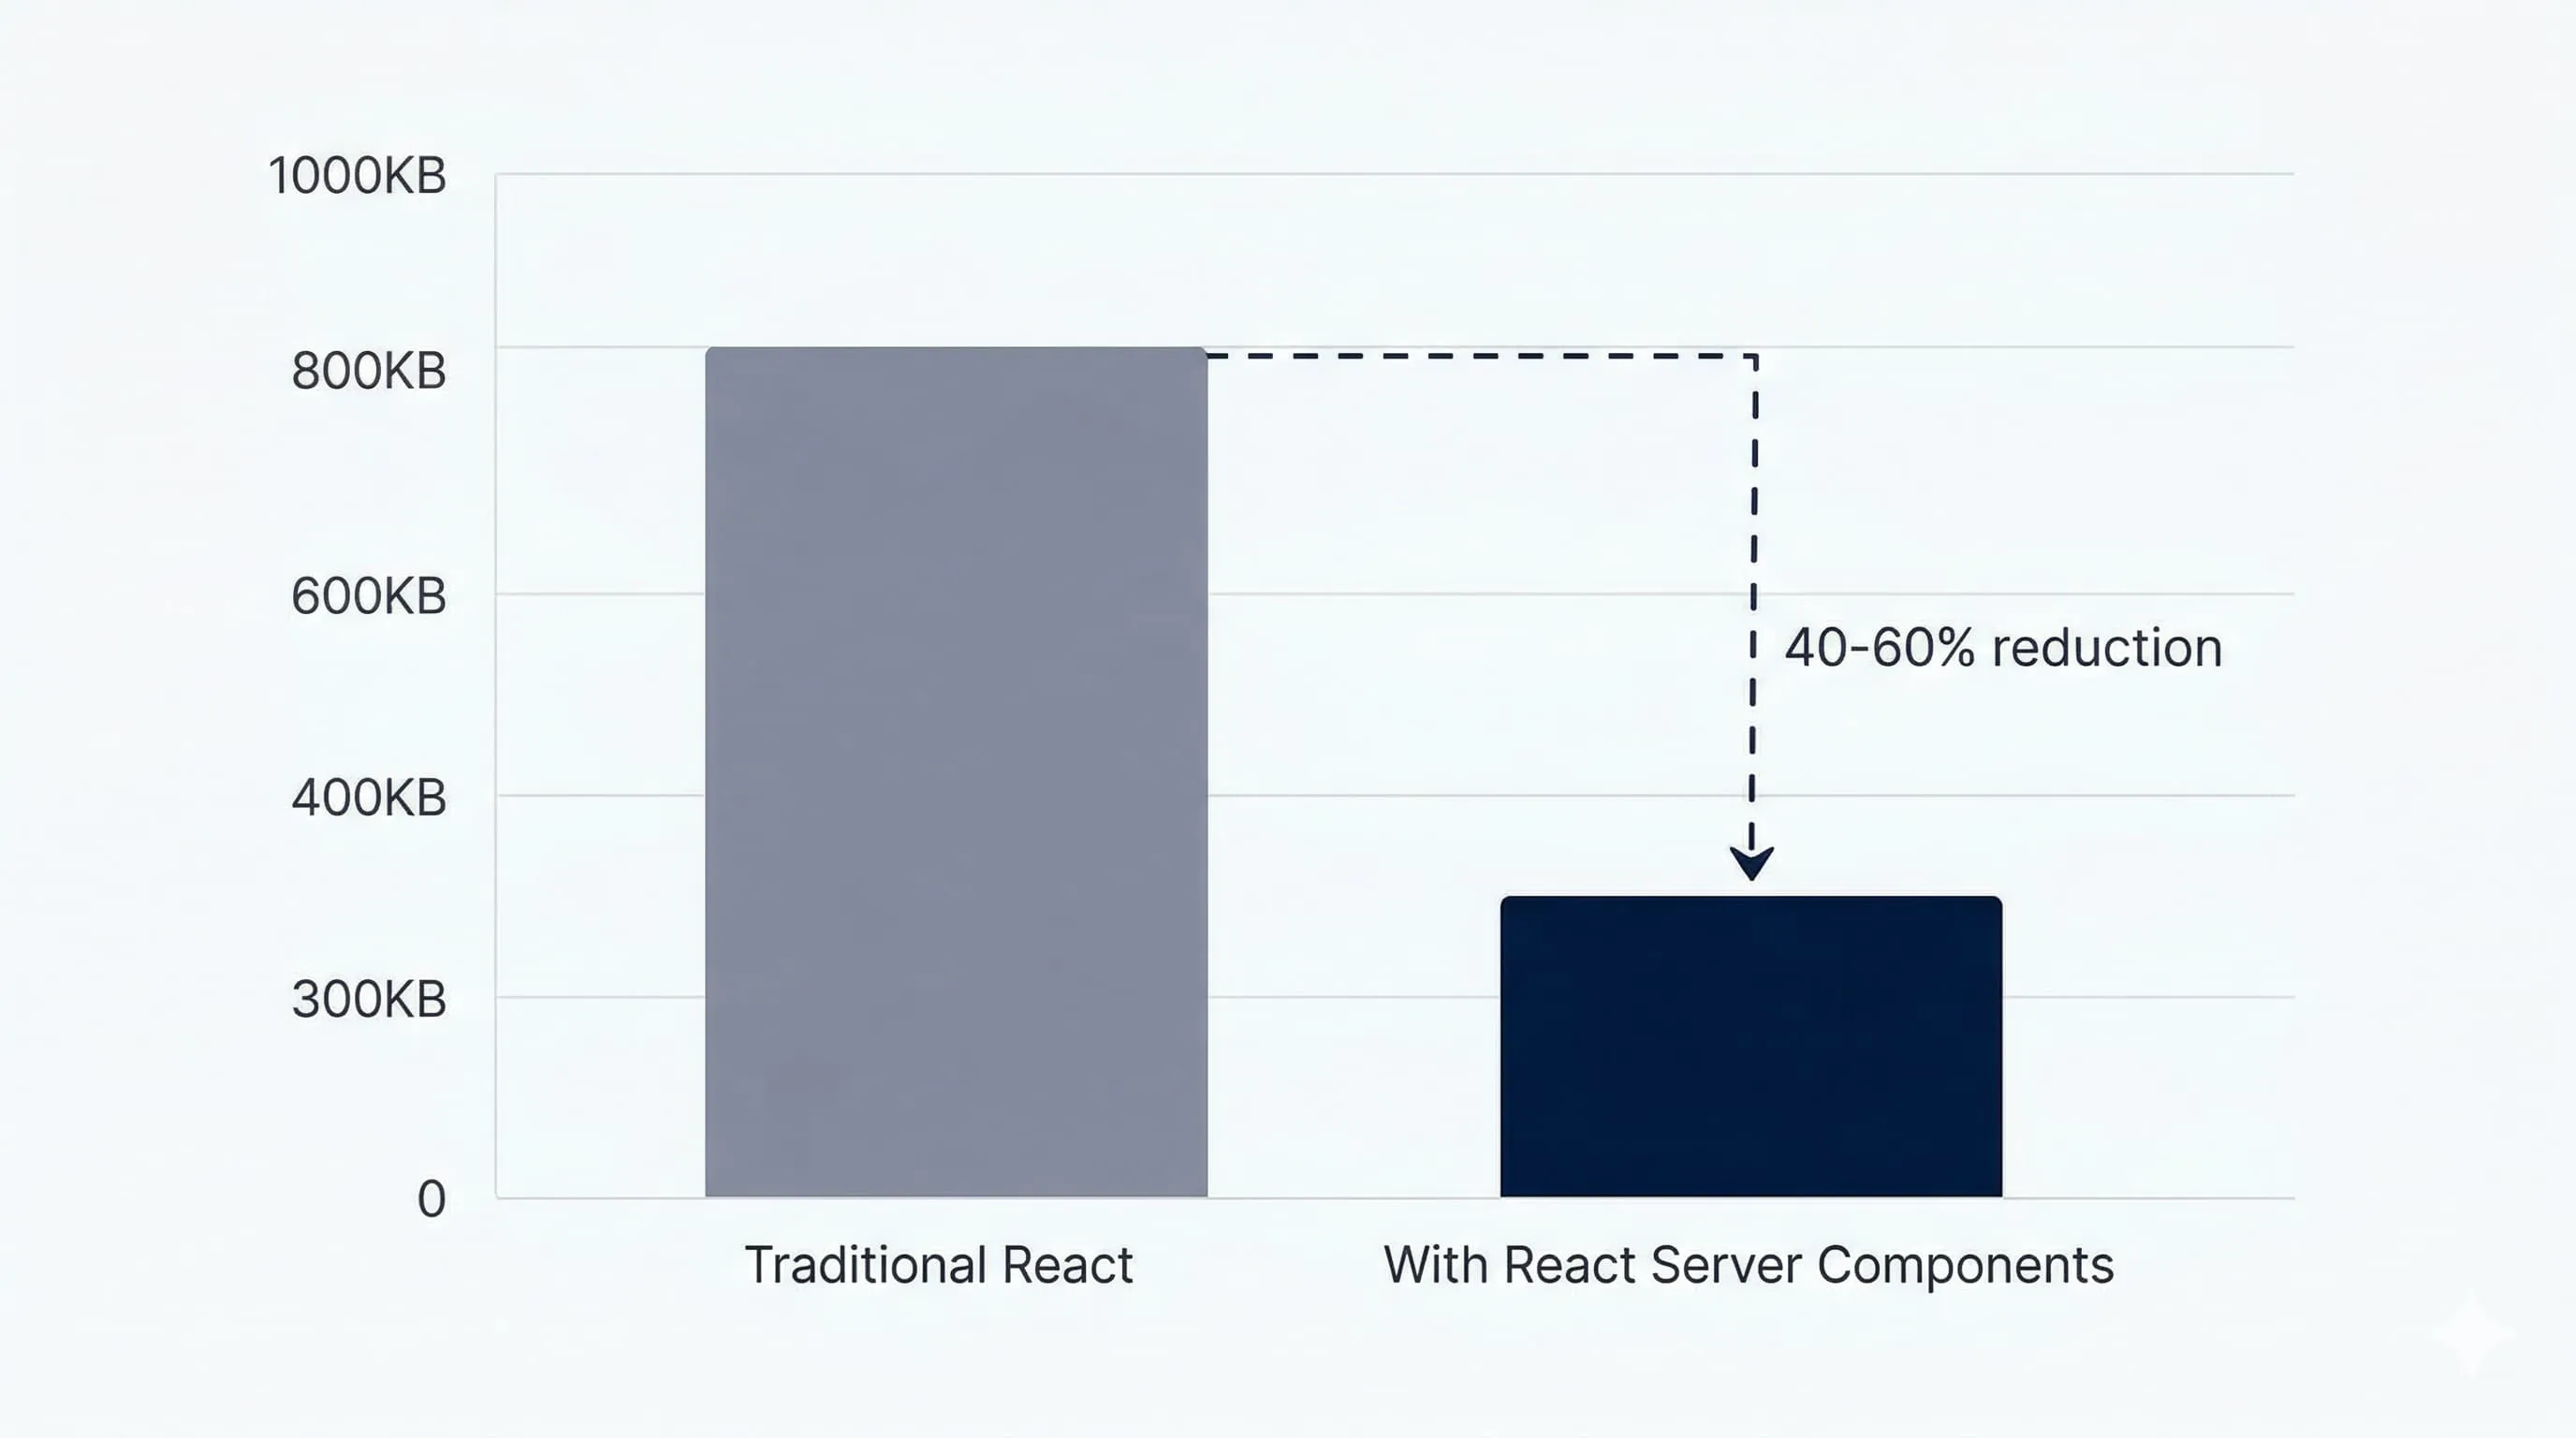
Every 100ms of added load time costs Amazon 1% in sales. For mid-market e-commerce sites, a 1-second delay reduces conversions by 7%. Google, Bing, and other search engines now use page speed as a ranking factor. Yet most businesses invest 10x more in design refreshes than performance optimization. A beautiful website that takes 4 seconds to load will always lose to a simpler one that loads in 1.2 seconds — in both rankings and revenue.
 Every additional second of load time costs 7% in conversions
Image optimization delivers 70% of the improvement
Images typically account for 60-80% of a page's total weight. Three changes produce immediate results: convert all images to WebP or AVIF format (40-60% smaller than JPEG with equal quality), implement responsive srcset attributes so mobile users don't download desktop-sized images, and add loading='lazy' to every image below the fold. We've seen clients drop total page weight from 4MB to under 800KB with this single change, cutting LCP from 3.8s to 1.1s.
CDN and caching strategies that compound over time
Implementing proper Cache-Control headers with immutable hashes for static assets, deploying behind a CDN like Cloudflare or Vercel Edge Network, and enabling stale-while-revalidate patterns can reduce server response times from 800ms to under 50ms for repeat visitors. These are configuration changes, not code rewrites. The impact compounds: as your CDN cache warms up, 80-90% of requests never hit your origin server.
JavaScript bundle audit and tree-shaking
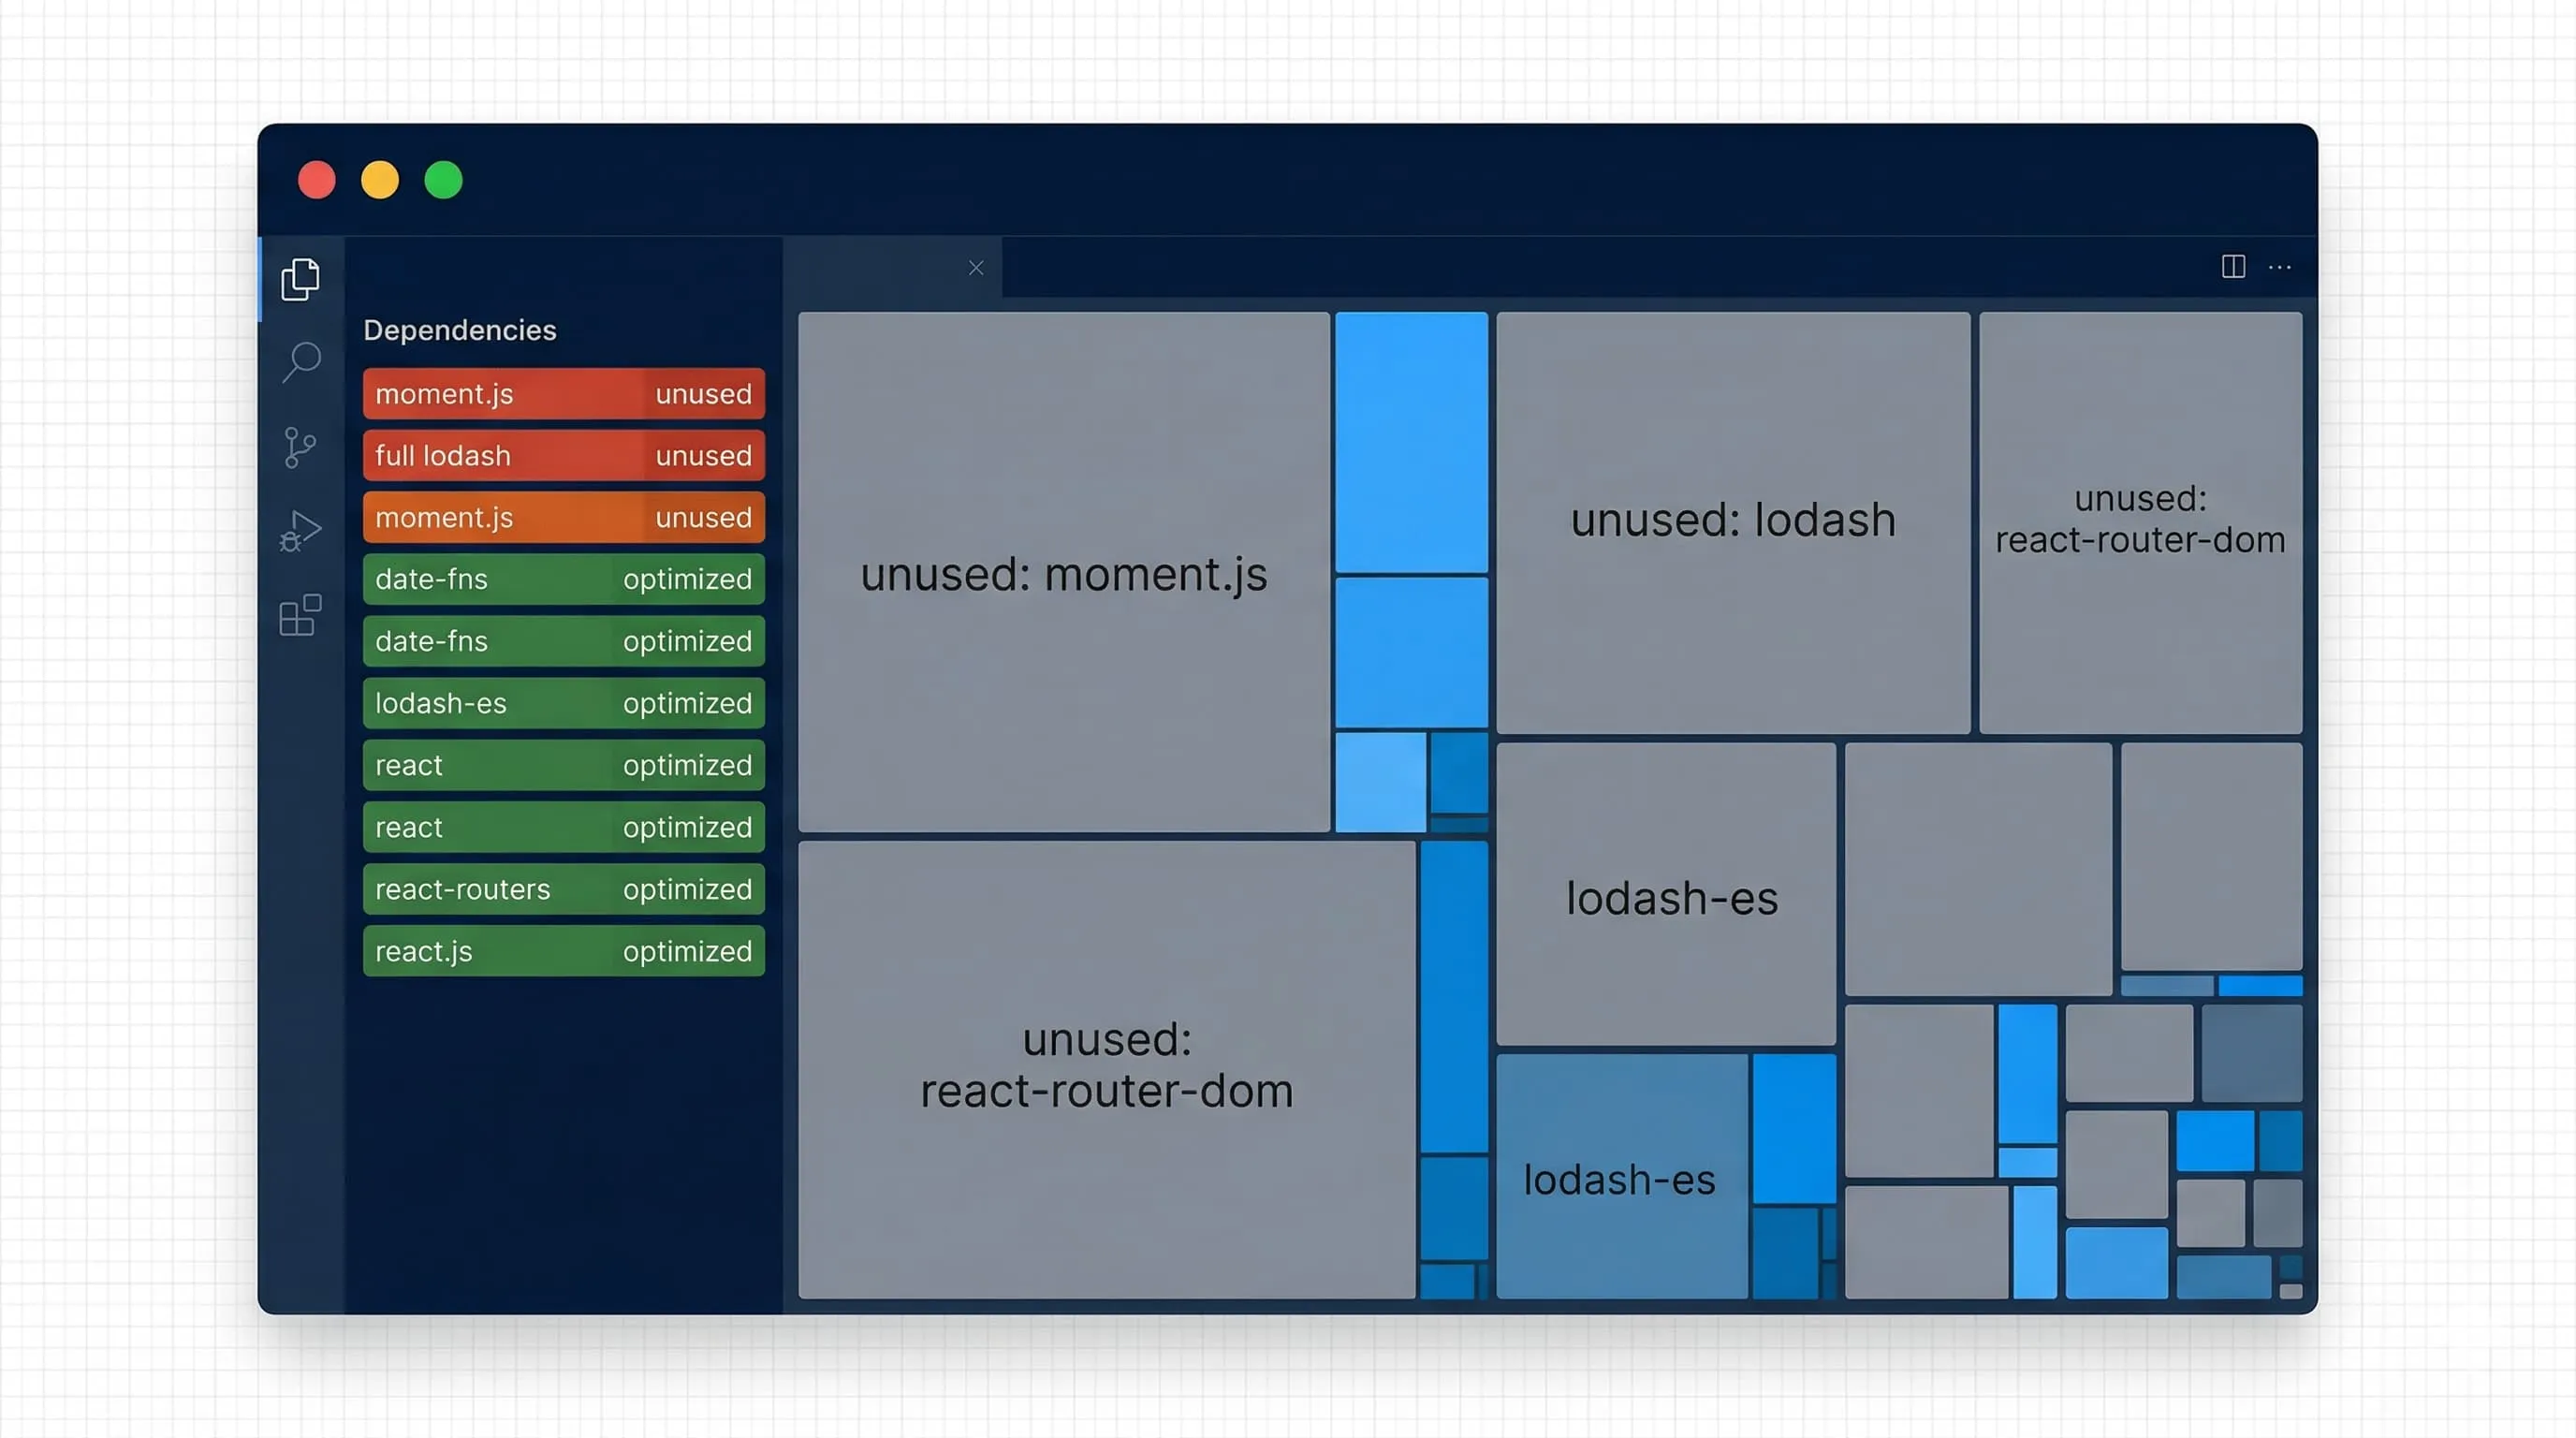
Install webpack-bundle-analyzer and run a production build analysis. You'll likely discover that 30-40% of your JavaScript consists of unused library code. Common offenders: moment.js (330KB) when date-fns (12KB) works, the entire lodash library when you use 3 functions. Switch to ESM imports and use dynamic imports for heavy components below the fold. These changes typically cut JS bundle size by 40-50%.
 Bundle analysis reveals 30-40% of JavaScript is typically unused
Server response time and database optimization
If your Time to First Byte (TTFB) exceeds 600ms, no amount of frontend optimization will save you. Check your database queries — are you running N+1 queries? Missing indexes on frequently filtered columns? Add database connection pooling, implement query result caching with Redis, and ensure your application server is in the same region as your database.
Measuring and maintaining performance gains
Set up Real User Monitoring (RUM) with tools like Vercel Analytics or Datadog RUM. Create performance budgets: JS bundle under 200KB, total page weight under 1MB, LCP under 2.5s. Add Lighthouse CI to your deployment pipeline so every pull request shows the performance impact before merging. If your website needs a performance overhaul, our engineering team specializes in optimizing Next.js and React applications — we typically achieve 50-70% load time reductions in the first sprint.
Need help with this?
We build the systems described in this article. Let’s talk about your project.
Keep reading
Related articles

Web DevelopmentMarch 28, 2026
Why We Build UAE and UK Business Websites in Next.js (and When We Don't)
Most of the business websites we ship for UAE and UK clients are built in Next.js. Here is what that means for your speed, Google rankings and hosting bill, and the three cases where we recommend something else.
3 min read
Read article
BusinessFebruary 18, 2026
How to Hire a Software Development Company in the UAE Without Getting Burned
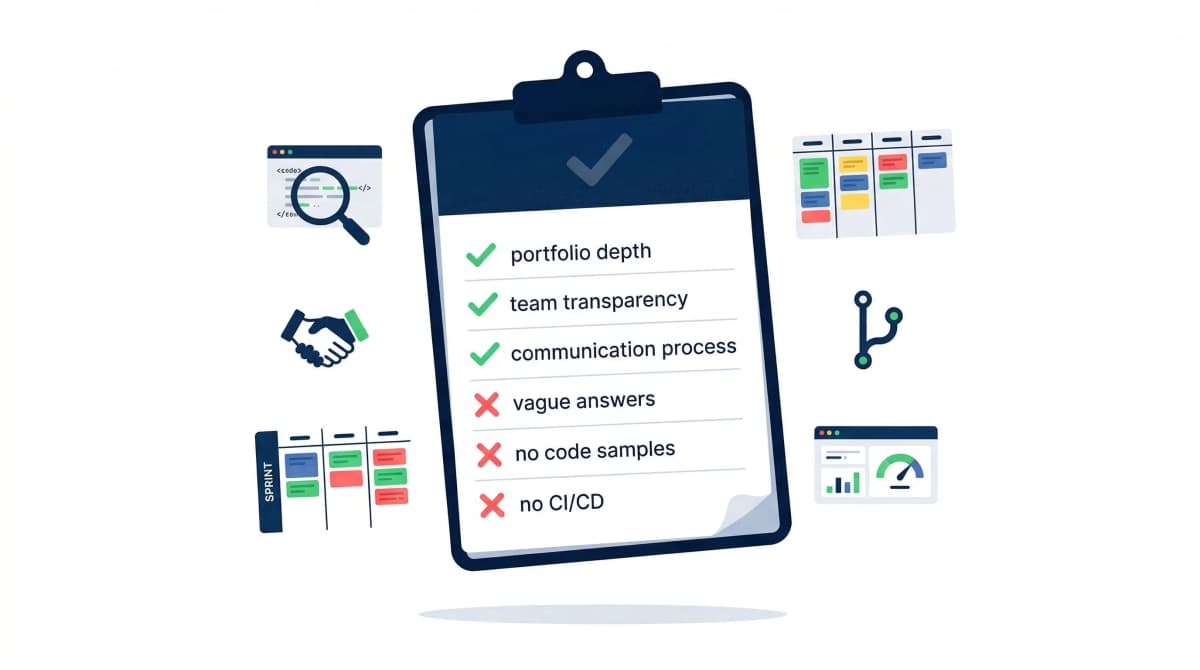
Most bad software projects in the UAE fail at the hiring stage, not the coding stage. The questions to ask, the contract terms that protect you, and the red flags that mean walk away.
2 min read
Read article